Control
I originally did this lab with open loop, but later updated it with orientation control. Thus, it allowed me to compare the two methods side by side.
UPDATE: Orientation Control
The PD orientation control implemented from lab 11 and 12 allowed me to update my mapping lab for higher accuracy. The process of implementation of orientation control was very similar to the position control in PID lab 6. Despite the instability of the motor control, orientation control assumed that the robot will rotate on a single axis, which was variant time to time. The robot was set to measure every 20 degrees with a total rotation of 360 degrees. I used one ToF sensor, so it gave me total of 40 data points (2 iteration) per point. Below is the robot rotating in orientation control.
Open loop lab
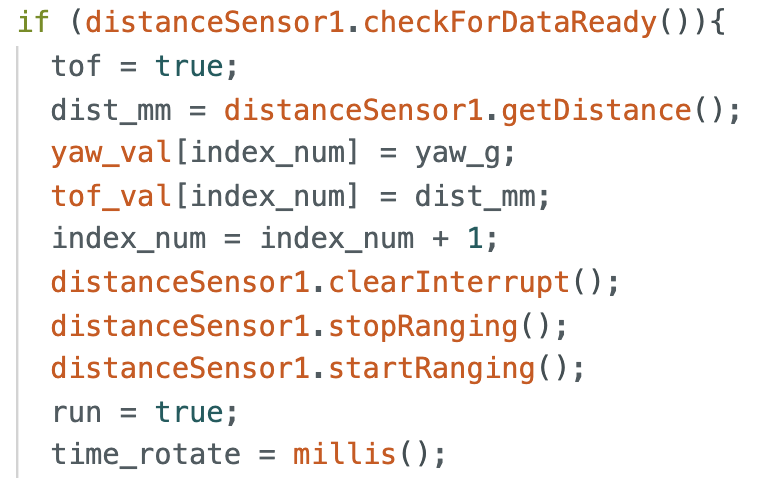
Because I was pressed on time, I opted to open loop control to rotate the robot. For more accurate ToF sensor outputs, the open loop consisted of rotating for certain amount and stopping for data acquisition. After multiple trial and errors, I ended up rotating the robot for 85ms and then stopping for total of 25 data points for each position in the map. The code snippet below shows the lab.

This is the video of the robot rotating in open loop.
Comparison
For both cases, the robot didn't rotate on a constant axis and drifting occurred (about 5 ~ 10 centimeters from the center). However, it can be seen that the angle change for orientation control is definitely constant since for open loop control, the motor was too unstable to make constant angle rotation.
Mapping
For each stop, the robot saved the ToF sensor readings as well as the IMU values to get the yaw of the robot. Since the IMU measures the angular speed of the robot, we need to integrate IMU's z-axis values to get the angular position of the robot. The code for data acquisition is shown below.

The collected data for each trial was stored in an array and sent at the end of the trial. I used a different command in jupyter just for the data collection, and stored it in python through the callback function. The final data that was sent to python was just the tof sensor and the yaw values in degrees.
Reading Distances
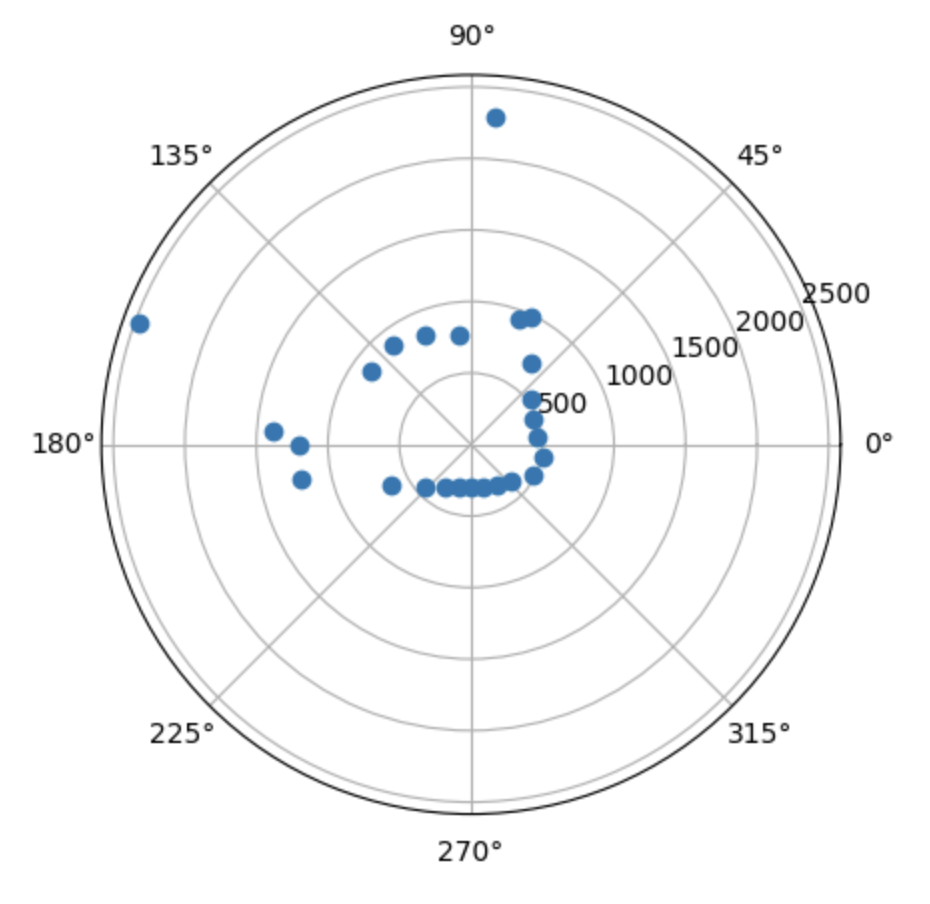
For each point of measurement [(-3,-2), (0,3), (5,3), (5,-3)], the robot rotates at relatively constant velocity, collects ToF and yaw values for each position, and after the collection is finished it sends the measured data through bluetooth. The images below are polar graphs of the distance values read for each point. For more accurate map, multiple trials were measured. This polar map was a sanity check before moving on to the next step. The images below are from open loop control session, but same was done on the orientation control.
(-3,-2)

(0,3)

(5,3)

(5,-3)

Mapping finished
To combine all four measurement points to create the whole map of the room, I needed to convert all data points to Cartesian coordinates and add the x and y offset. First, since given coordinates are in feet, I converted all of them to mm by multiplying with a factor of 304.8 mm/ft. The code used to convert is attached below, which I borrowed from last year's student -- Linda Li.

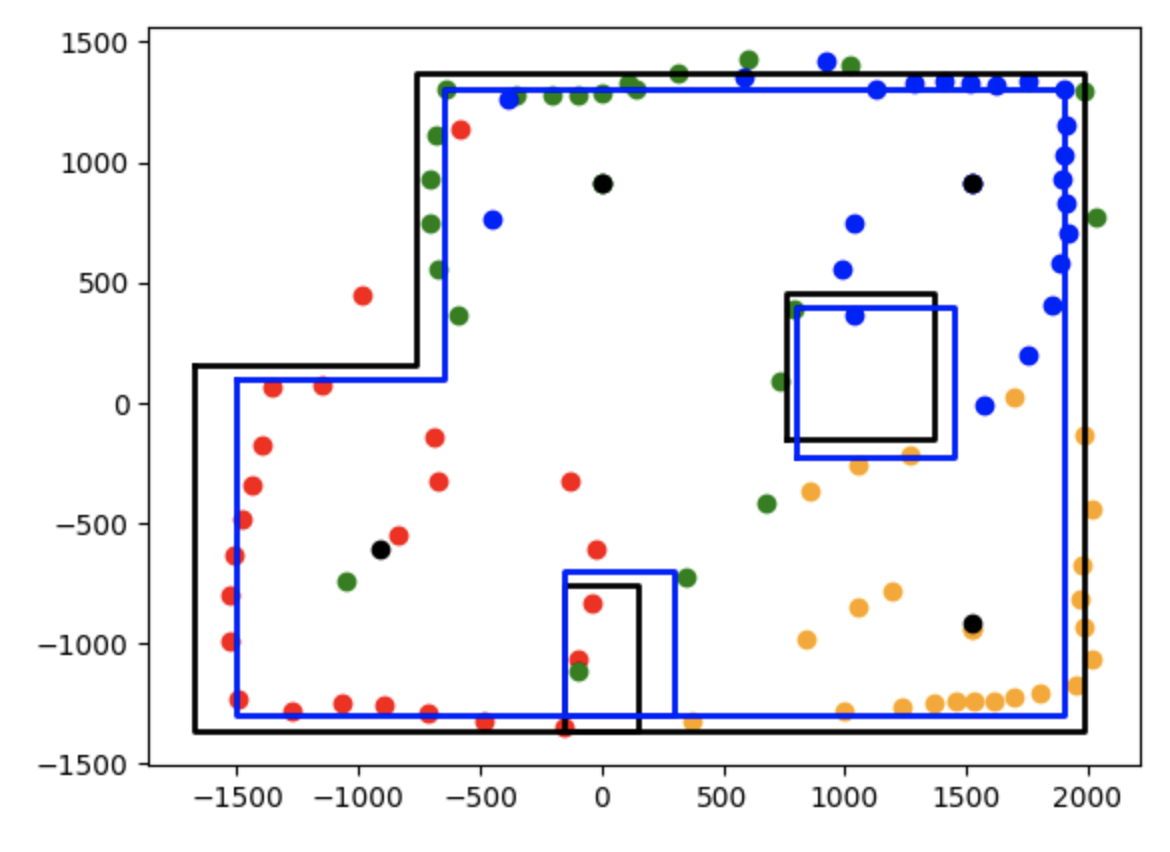
The image below is the accumulated data points of the four measuring points.
Orientation control

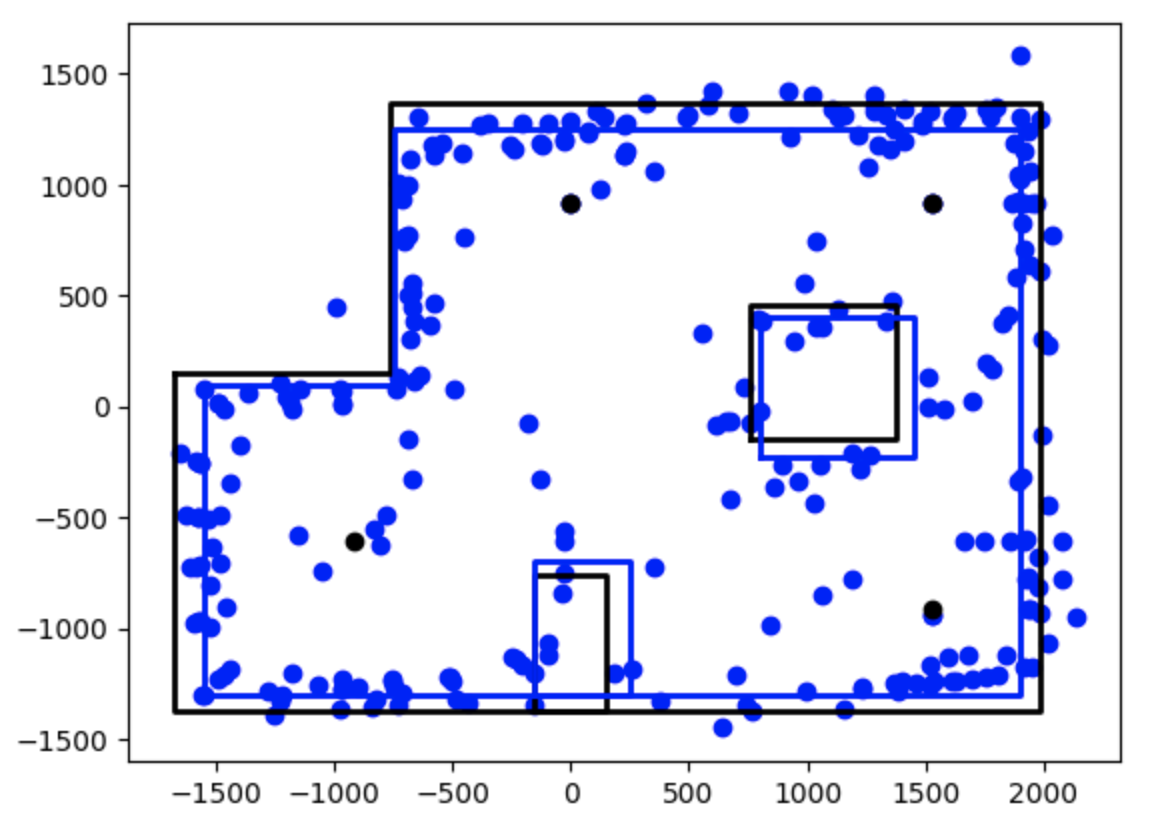
The accuracy of the distance sensor is definitely low for long distances, as seen in the extraneous data points in the middle of the arena. Another problem spot is the small box in the middle-bottom part of the arena, since the width is too small and the height is not covered my a lot of the measuring points. But overall, the distance measurment and mapping in the near corner looks pretty close to the actual arena, so I am satisfied with the mapping.
Open loop control

From this, we can conclude that the robot's measurment for long distances are very unreliable. When the distance from the wall is more than 2500mm, such as the lonely orange dot on the left bottom side of the map, the measurements tend to be very off. Furthermore, the robot is very inaccurate when it is facing the corners of the wall or the box, resulting in slightly curved-looking data points.
Comparison
After doing orientation control mapping, I realized that the accuracy between the two is not as substantial as I thought it would be, but it is not negligible. With orentation control, there are less points on the empty spots of the arena, and the map of the boxes are more prominent. However, for both of the maps, the drifting of the robot is definitely a big source of error, as seen by the un-straight lines of the wall. Moreover, with orientation control I did more data collection through repetition and more data (however noisy it is) is definitely better than less.
Conclusion
The whole data points with the outline of the actual map is seen below. The black outline represents the actual map of the room, whereas the blue is the approximate outline that my robot created.

With all the data points accumulated, the mapping is more pronounced, but low accuracy for the two boxes is still very prominent. The errors o this mapping is most likely going to be aligned with the errors in localization in lab 11 as well.